

File:QuiXoT threeLevels.png

Size of this preview: 219 × 599 pixels. Other resolutions: 87 × 240 pixels | 457 × 1,250 pixels.
Original file (457 × 1,250 pixels, file size: 38 KB, MIME type: image/png)
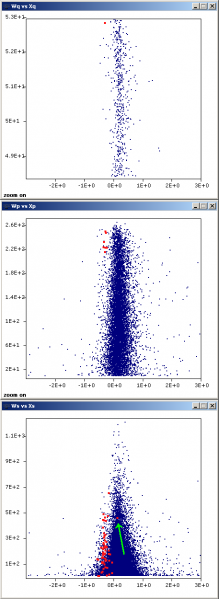
Example of a protein with a statistically significative expression change (top), showing the peptides associated (middle), and its scans (bottom). The green arrow in the last graph is indicating a scan which independently would be considered as non-changing. However, taking all the scans and peptides into account, it arises as a scan-level outlier with an FDRs < 0.1%
File history
Click on a date/time to view the file as it appeared at that time.
| Date/Time | Thumbnail | Dimensions | User | Comment | |
|---|---|---|---|---|---|
| current | 15:22, 17 September 2013 | 457 × 1,250 (38 KB) | Mtrevisan (talk | contribs) | Example of a protein with a statistically significative expression change (top), showing the peptides associated (middle), and its scans (bottom). The green arrow in the last graph is indicating a scan which independently would be considered as non-cha... |
- You cannot overwrite this file.
File usage
The following page links to this file: