File:Gauss outGraph.png
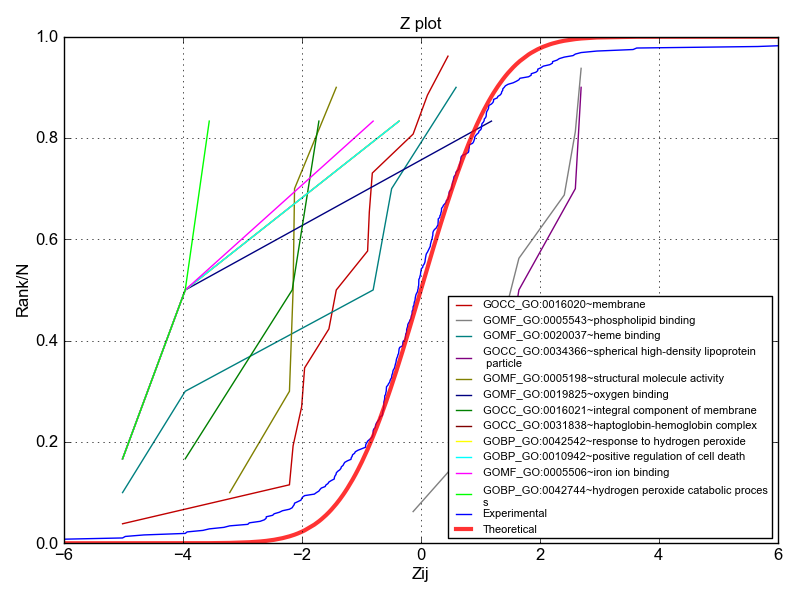
Revision as of 11:49, 5 March 2018 by Mtrevisan (talk | contribs) (Output of SanXoTGauss in Test 3, showing the theoretical sigmoid for the standard normal distribution (red), the experimental sigmoid for all the proteins in the experiment (blue), and the sigmoid of proteins grouped by ontology (selecting with SanXoTS...)
Gauss_outGraph.png (800 × 600 pixels, file size: 118 KB, MIME type: image/png)
Output of SanXoTGauss in Test 3, showing the theoretical sigmoid for the standard normal distribution (red), the experimental sigmoid for all the proteins in the experiment (blue), and the sigmoid of proteins grouped by ontology (selecting with SanXoTSqueezer only categories that are changing expression with FDR >= 5% and having at least 3 proteins).
File history
Click on a date/time to view the file as it appeared at that time.
| Date/Time | Thumbnail | Dimensions | User | Comment | |
|---|---|---|---|---|---|
| current | 11:29, 17 August 2018 |  | 800 × 600 (118 KB) | Mtrevisan (talk | contribs) | |
| 11:49, 5 March 2018 |  | 800 × 600 (102 KB) | Mtrevisan (talk | contribs) | Output of SanXoTGauss in Test 3, showing the theoretical sigmoid for the standard normal distribution (red), the experimental sigmoid for all the proteins in the experiment (blue), and the sigmoid of proteins grouped by ontology (selecting with SanXoTS... |
- You cannot overwrite this file.
File usage
The following page links to this file:


