

File:Screenshot QuiXoT-WsvsXs-Xp.PNG
No higher resolution available.
Screenshot_QuiXoT-WsvsXs-Xp.PNG (457 × 417 pixels, file size: 12 KB, MIME type: image/png)
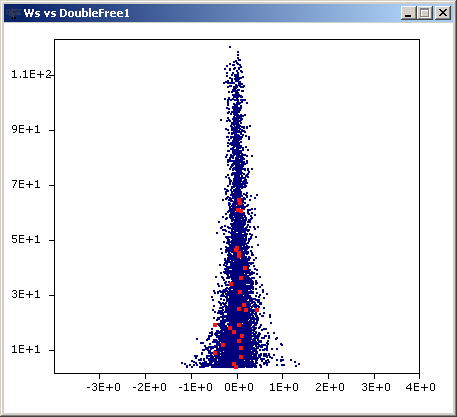
Graph window showing the Ws vs Xs-Xp plot (i.e., the weight of each scan in the Y-axis, compared to the log2ratio of each scan centred on its peptide).
File history
Click on a date/time to view the file as it appeared at that time.
| Date/Time | Thumbnail | Dimensions | User | Comment | |
|---|---|---|---|---|---|
| current | 16:54, 13 September 2013 | | 457 × 417 (12 KB) | Mtrevisan (talk | contribs) | Graph window showing the Ws vs Xs-Xp plot (i.e., the weight of each scan in the Y-axis, compared to the log2ratio of each scan centred on its peptide). |
- You cannot overwrite this file.
File usage
There are no pages that link to this file.